The Salesforce Developer Console is an integrated development environment (IDE) that provides essential tools for creating, debugging, and testing applications within Salesforce. Every Salesforce developer, admin, and architect needs to understand how to effectively use the Developer Console for daily development tasks, troubleshooting, and performance analysis.
What is Salesforce Developer Console?
The Salesforce Developer Console is a web-based development environment that provides a comprehensive set of tools and resources for building, debugging, and testing Salesforce applications. It serves as the primary interface for writing Apex code, creating Lightning components, executing SOQL queries, and analyzing system performance.
Key capabilities include:
- Apex class and trigger development
- Lightning Web Component (LWC) and Aura component creation
- Visualforce page development
- Real-time debugging with breakpoints
- SOQL and SOSL query execution
- Log inspection and analysis
- Performance monitoring and optimization
How to Open Developer Console in Salesforce
To access the Salesforce Developer Console, follow these steps:
- Log into your Salesforce org
- Click on your profile picture or name in the top-right corner
- Select Developer Console from the dropdown menu
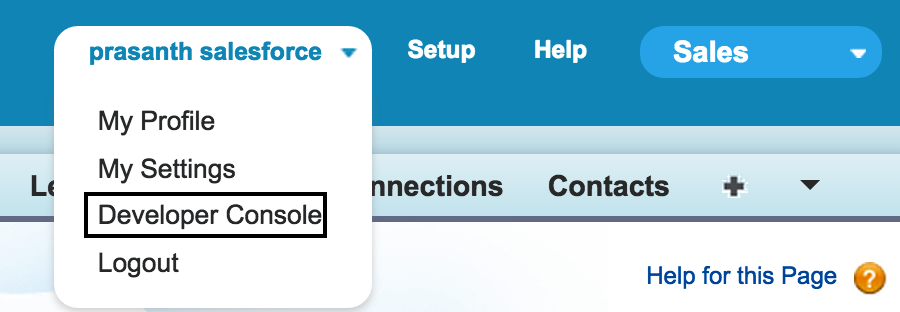
Note: The screenshot above shows the Classic interface. In Lightning Experience, the Developer Console option appears in the App Launcher (9-dot grid) under “Tools” or via the profile menu.
Developer Console Features for Salesforce Development
Code Development and Management
The Developer Console provides a full-featured code editor with syntax highlighting, auto-completion, and error detection. You can:
- Create and edit Apex classes, triggers, and test classes
- Develop Lightning Web Components with HTML, JavaScript, and CSS
- Build Visualforce pages and components
- Manage static resources and custom metadata
Debugging and Troubleshooting
Advanced debugging capabilities include:
- Setting breakpoints in Apex code
- Step-through debugging with variable inspection
- Real-time log monitoring
- Exception handling and stack trace analysis
- Performance profiling with execution time metrics
Query Execution and Data Analysis
Execute and optimize database queries:
- SOQL query builder with syntax validation
- SOSL search query testing
- Query plan analysis for performance optimization
- Result set inspection and export
Salesforce Developer Console Best Practices
Code Organization
- Use meaningful class and method names
- Implement proper exception handling
- Follow Apex coding standards and governor limits
- Write comprehensive test classes with 75%+ coverage
Debugging Strategies
- Set appropriate log levels (DEBUG, INFO, WARN, ERROR)
- Use System.debug() statements strategically
- Monitor governor limit consumption
- Analyze heap size and CPU time usage
Performance Optimization
- Review query execution plans
- Identify and resolve N+1 query patterns
- Optimize SOQL queries with proper indexing
- Monitor API call limits and bulk operations
Common Developer Console Use Cases
Apex Development
Create production-ready Apex code with proper error handling:
public class AccountProcessor {
    public static void updateAccountRatings(List<Account> accounts) {
        try {
            List<Account> accountsToUpdate = new List<Account>();

            for (Account acc : accounts) {
                if (acc.AnnualRevenue != null && acc.AnnualRevenue > 1000000) {
                    acc.Rating = 'Hot';
                    accountsToUpdate.add(acc);
                }
            }

            if (!accountsToUpdate.isEmpty()) {
                update accountsToUpdate;
            }
        } catch (DmlException e) {
            System.debug('Error updating accounts: ' + e.getMessage());
            throw e;
        }
    }
}
SOQL Query Testing
Test and optimize queries before implementation:
SELECT Id, Name, Industry, AnnualRevenue
FROM Account
WHERE AnnualRevenue > 1000000
AND Industry IN ('Technology', 'Healthcare')
ORDER BY AnnualRevenue DESC
LIMIT 100
Integration with Salesforce Development Workflow
The Developer Console integrates seamlessly with Salesforce development patterns and deployment processes. Use it alongside:
- Salesforce CLI for source-driven development
- Version control systems (Git) for code management
- Continuous integration pipelines
- Sandbox and production deployment strategies
Troubleshooting Common Issues
Performance Problems
- Monitor CPU time limits (10 seconds synchronous, 60 seconds asynchronous)
- Check heap size consumption (6MB synchronous, 12MB asynchronous)
- Optimize SOQL queries to avoid full table scans
- Implement proper bulkification patterns
Debug Log Analysis
- Set appropriate log levels for different components
- Use log categories to filter relevant information
- Monitor governor limit warnings
- Analyze execution flow and timing
Security Considerations
When using the Developer Console, consider these security aspects:
- Ensure proper field-level security (FLS) checks in Apex
- Implement CRUD permissions validation
- Use “with sharing” keywords appropriately
- Validate user permissions before data operations
- Sanitize user inputs to prevent injection attacks
Frequently Asked Questions
How do I execute Apex code in Salesforce Developer Console?
Open Developer Console, go to Debug menu, select “Open Execute Anonymous Window”, paste your Apex code, and click Execute. You can also set “Open Log” checkbox to view execution details immediately.
Can I debug Apex triggers in Developer Console?
Yes, you can debug triggers by setting breakpoints in the trigger code and monitoring debug logs. Use System.debug() statements and check the debug log levels to capture trigger execution details.
What are the governor limits I should monitor in Developer Console?
Key limits include: 100 SOQL queries per transaction, 50,000 records per SOQL query, 10 seconds CPU time (synchronous), 6MB heap size (synchronous), and 150 DML statements per transaction. Monitor these in debug logs.
How do I create test classes in Developer Console?
Go to File > New > Apex Class, name your class with “Test” suffix, add @isTest annotation, and write test methods with @isTest annotation. Use Test.startTest() and Test.stopTest() to reset governor limits within tests.
Can I use Developer Console for Lightning Web Component development?
Yes, Developer Console supports LWC development. You can create, edit, and debug Lightning Web Components, though many developers prefer VS Code with Salesforce Extensions for enhanced LWC development experience.