A Salesforce dashboard displays visual representations of report data through charts, graphs, and metrics. Dashboards help users quickly understand key performance indicators and business trends without analyzing raw report data.
This guide covers dashboard creation in both Lightning Experience and Salesforce Classic, including component types, data source configuration, and sharing permissions.
What is a Dashboard in Salesforce?
Dashboards are visual representations of data generated from Salesforce reports. Each dashboard contains up to 20 components that display report data as charts, tables, gauges, or metrics. Dashboard components refresh automatically when underlying report data changes.
Dashboard components include:
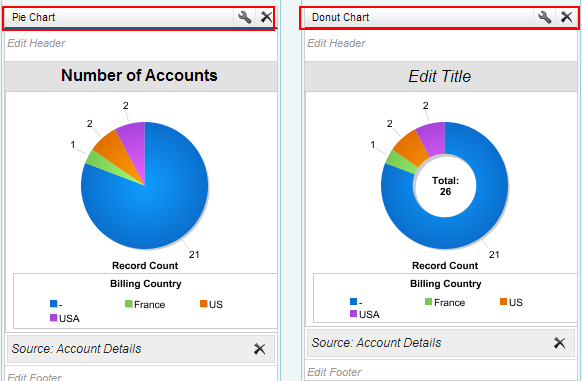
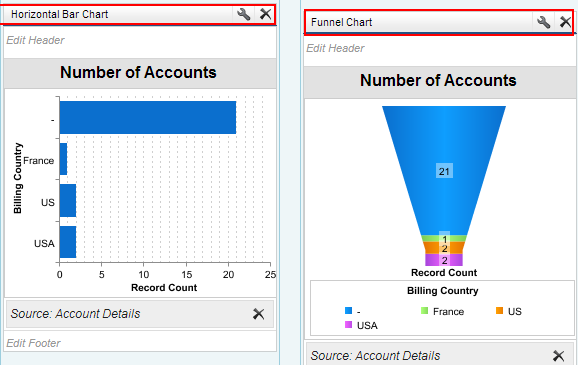
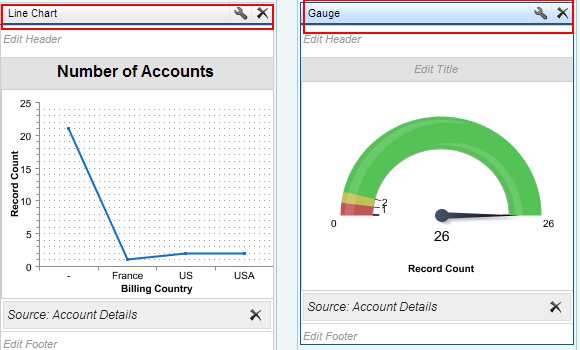
- Charts: Bar, column, line, pie, donut, funnel, and scatter charts
- Gauges: Visual indicators showing progress toward goals
- Metrics: Single number displays with optional comparisons
- Tables: Tabular data displays from report results
How to Create a Dashboard in Salesforce Lightning Experience
Follow these steps to create a dashboard in Lightning Experience:
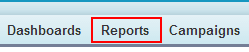
- Navigate to the Reports tab from the App Launcher
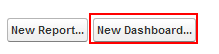
- Click New Dashboard in the top-right corner
- Enter a dashboard name and optional description
- Select a folder location (My Personal Dashboards or shared folder)
- Choose Lightning Experience as the dashboard type
- Click Create
The Lightning dashboard builder opens with a drag-and-drop interface for adding components.
Adding Components to Lightning Dashboards
To add components:
- Click + Component in the dashboard builder
- Select a report as the data source
- Choose a component type (Chart, Metric, or Table)
- Configure display properties and filters
- Click Add to place the component
How to Create a Dashboard in Salesforce Classic
For Salesforce Classic users, follow this process:
Go to the Reports tab.
Click on New Dashboard.
The dashboard builder screen opens with two main sections:
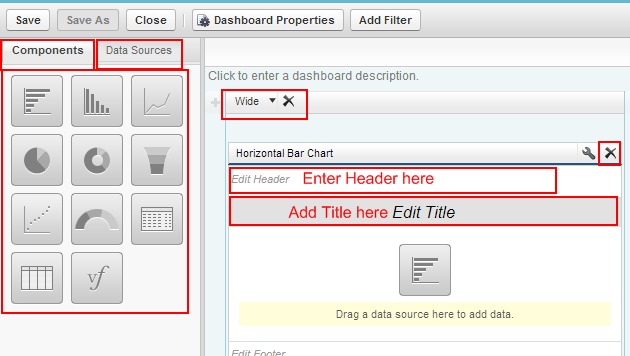
Dashboard Builder Components
The dashboard builder contains two key sections:
- Components: Visual elements like pie charts, gauges, graphs, tables, and funnels
- Data Sources: Reports that provide data for dashboard components
Component sizing options:
- Wide: Full-width components spanning the entire dashboard
- Medium: Half-width components allowing two per row
- Narrow: Quarter-width components allowing four per row
Adding Components in Classic
To add dashboard components:
- Select a component size (Wide, Medium, or Narrow)
- Drag a component type to the dashboard canvas
- Navigate to the Data Sources section
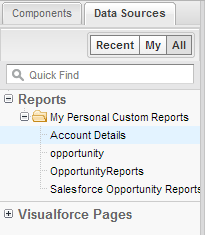
Select a report from Data Sources and drag it onto the dashboard component.
The example above shows a dashboard component displaying account data in a graphical format. Each dashboard supports up to 20 components with configurable security permissions.
Dashboard Folder Security and Sharing
Dashboard access depends on folder permissions:
- Public folders: Visible to all users with dashboard access
- Hidden folders: Visible only to folder owners and administrators
- Restricted folders: Limited to specific users, roles, or public groups
Users need “View Dashboards” permission and access to underlying reports to view dashboard data.
Dashboard Best Practices
Follow these guidelines for effective dashboards:
- Use meaningful component titles and descriptions
- Group related metrics on the same dashboard
- Limit dashboards to 10-15 components for optimal performance
- Schedule dashboard refreshes during off-peak hours
- Test dashboard performance with different user profiles
- Use consistent color schemes across related components
Dashboard Refresh and Scheduling
Dashboards refresh automatically when users view them, but you can schedule automatic refreshes:
- Open the dashboard in edit mode
- Click Schedule Refresh
- Set refresh frequency (daily, weekly, or monthly)
- Choose specific times and recipients for email notifications
- Save the schedule
Scheduled refreshes help ensure dashboard data stays current without manual intervention.
Troubleshooting Common Dashboard Issues
Common dashboard problems and solutions:
- “Insufficient Privileges” error: User lacks access to underlying reports or dashboard folder
- Blank components: Source report contains no data or has restrictive filters
- Slow loading: Too many components or complex report queries
- Data not updating: Report data hasn’t refreshed or dashboard cache needs clearing
Frequently Asked Questions
How many components can I add to a Salesforce dashboard?
Each Salesforce dashboard supports up to 20 components. This limit applies to both Lightning Experience and Salesforce Classic dashboards.
Can I create a dashboard without reports in Salesforce?
No, dashboards require reports as data sources. You must create or have access to reports before building dashboard components. Each component connects to a specific report for its data.
How do I schedule a dashboard refresh in Salesforce?
Open the dashboard, click “Schedule Refresh,” set the frequency (daily, weekly, monthly), choose specific times, and configure email notifications. Scheduled refreshes ensure data stays current automatically.
What permissions do users need to view Salesforce dashboards?
Users need “View Dashboards” permission, access to the dashboard folder, and read access to all reports used as data sources. Without these permissions, users see “Insufficient Privileges” errors.
How do I change the time zone for dashboard data in Salesforce?
Dashboard data displays in the user’s personal time zone setting. To change this, go to Setup > Personal Information > Language & Time Zone, then select your preferred time zone. Dashboard timestamps will update accordingly.