A Salesforce dashboard turns one or more saved reports into visual widgets that users can scan without opening every report. In Lightning Experience, an admin usually starts with report requirements, builds the reports with the right filters and groupings, then places chart, table, rich text, and image widgets on the dashboard.
This guide explains the build path, security decisions, limits, and review checks you should use before you publish a dashboard to sales, service, operations, or leadership teams.
What is a Salesforce dashboard?
A Salesforce dashboard is a Lightning analytics page made from widgets. Most widgets read data from source reports. Other widgets provide instructions, links, or supporting graphics. The dashboard itself does not replace the report layer; it depends on the report type, report filters, report groupings, folder sharing, and the dashboard running user.
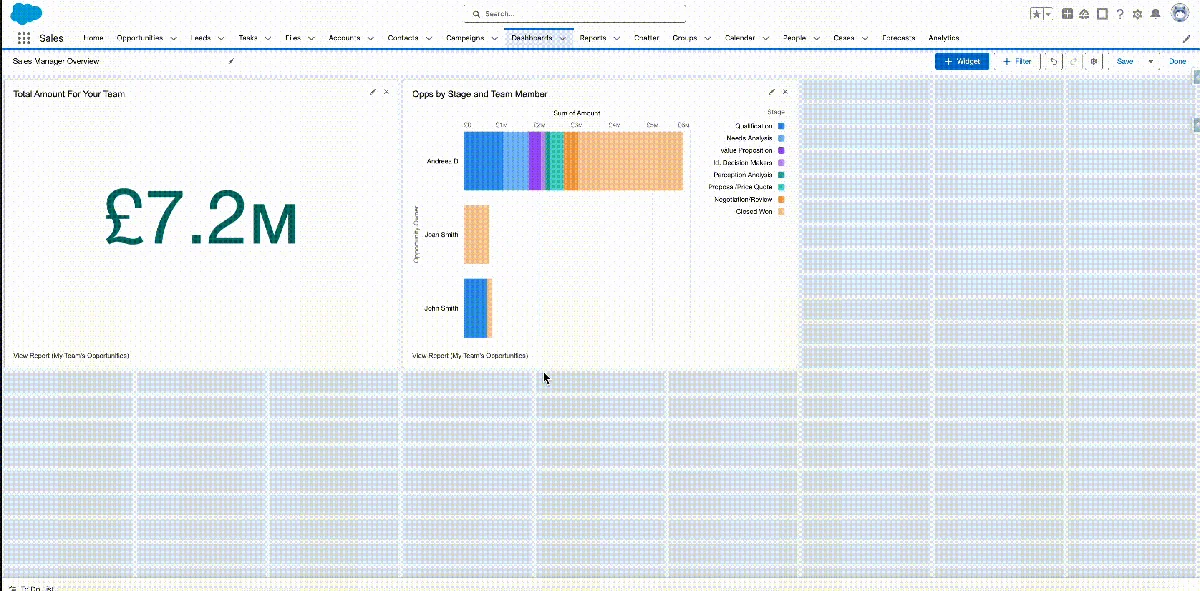
Use a dashboard when users need to compare several metrics on one page, such as total open pipeline, opportunities by stage, cases by priority, or lead conversion by owner. Keep the source reports available, because users often drill from a widget into the report to verify the records behind the number.
Salesforce dashboard prerequisites before you build
Before you open the Salesforce dashboard builder, confirm the reporting model. In enterprise orgs, poor Salesforce dashboard adoption usually starts with unclear source reports, not with the Salesforce dashboard layout.
- Report type: Choose the report type that exposes the objects and fields users need. For Opportunity dashboards, the standard Opportunities report type may be enough; custom objects often need custom report types.
- Filters: Add filters that match the business question. For example, pipeline dashboards often exclude Closed Lost opportunities unless the component is analyzing loss reasons.
- Groupings: Add row or column groupings when a chart needs categories, such as Stage, Owner, Close Month, Region, or Forecast Category.
- Summary values: Confirm whether the widget should show record count, amount sum, average age, maximum date, or another summary.
- Folder access: Put the source reports and dashboard in folders shared with the right users or public groups.
The official Trailhead project on creating reports and dashboards shows the basic Lightning path: create a report, group it, then add it to a dashboard widget. See Trailhead: Create a Dashboard for the hands-on flow.
How Salesforce dashboard widgets work
Lightning dashboards support chart or table widgets from reports, rich text widgets for guidance, and image widgets for logos or visual cues. Salesforce Help documents current dashboard limits, including up to 25 widgets per dashboard with limits for chart/table and image widgets. Always check Salesforce Reports and Dashboards Limits and Allocations before designing dashboards for a large rollout.
Chart and table widgets
Chart and table widgets connect to a saved report. A single report can support more than one widget, but do this only when each widget answers a distinct question. For example, one Opportunity report grouped by Owner and Stage can support a metric for total amount, a bar chart by owner, and a stacked bar chart by stage.
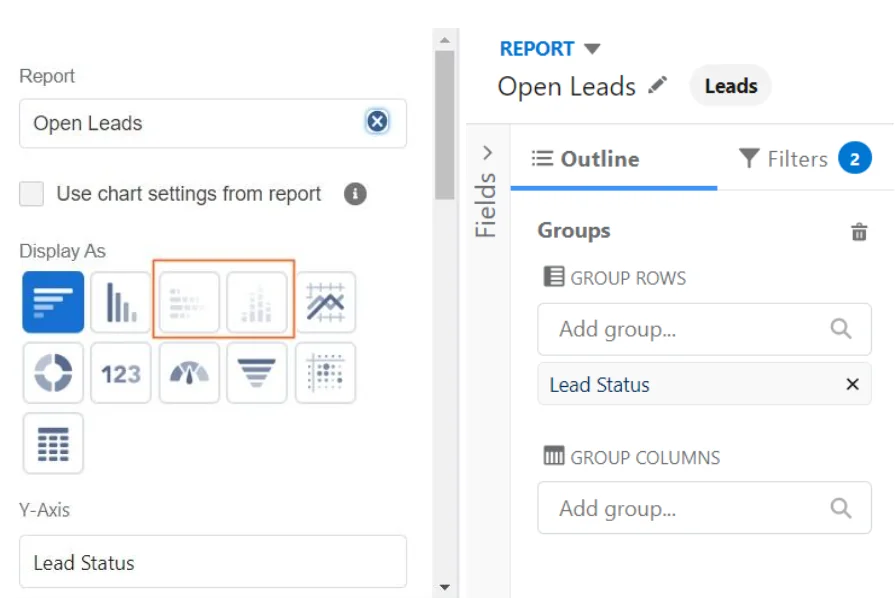
Why source report groupings control chart options
If a chart option is disabled, inspect the source report first. A metric widget can use a summary value, while grouped charts need grouped report output. Stacked visualizations usually need more grouping than a simple bar or donut chart. This is a common issue when admins ask, how do i create a dashboard in salesforce, build the canvas, and then find that the chart they wanted is unavailable.
Choosing chart types for dashboard questions
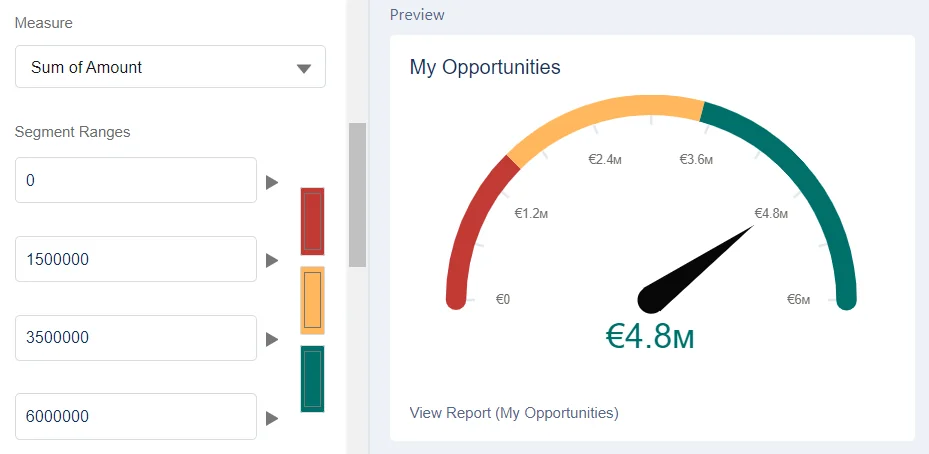
| Question | Useful widget | Report setup | Implementation note |
|---|---|---|---|
| What is the total open pipeline? | Metric | Opportunity report filtered to open opportunities, summarized by Amount | Use one clear number and place it near the top of the dashboard. |
| How close are we to a target? | Gauge | Summary value compared with a target range | Document the target source in rich text so users know whether it came from quota, forecast, or finance. |
| How is work distributed? | Donut or bar chart | Grouped by status, owner, type, stage, or region | Limit categories. Too many slices or bars make the chart hard to read. |
| Where should a manager drill in? | Table | Grouped report with the fields needed for follow-up | Keep table columns aligned with the next action, not with every available field. |
How to create a Salesforce dashboard in Lightning
The build path below assumes a sales manager wants a pipeline dashboard. The same pattern works for service operations, marketing response, renewal management, and custom object tracking.
How do i create a dashboard in Salesforce from reports?
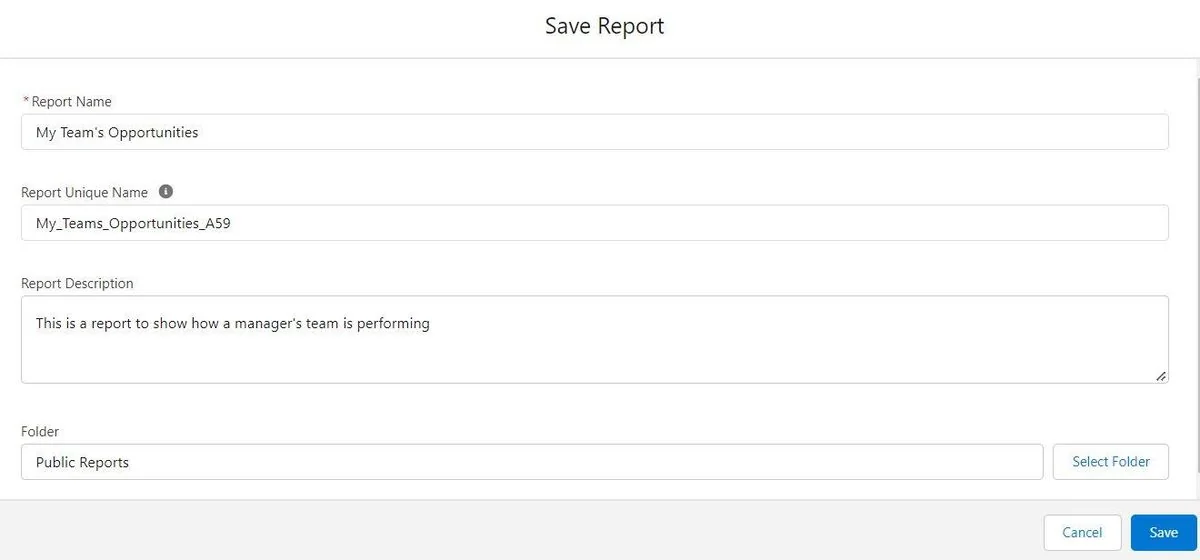
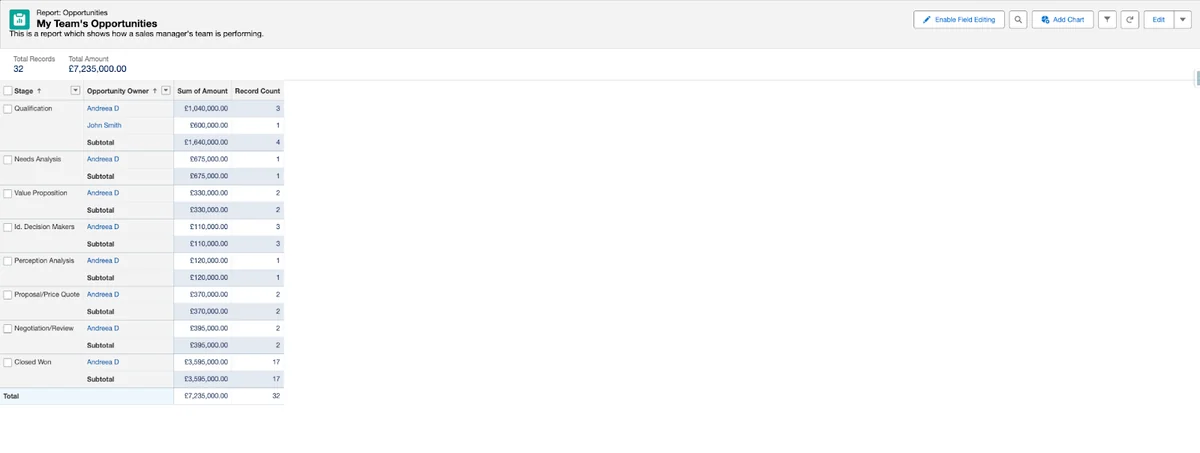
- Create the source report. Go to the Reports tab, choose the report type, add columns, filters, and groupings, then run the report.
- Save the report in the right folder. Use a folder shared with the dashboard audience. If users cannot access the report folder, drill-through can fail even when the dashboard widget displays.
- Open the Dashboards tab. Click New Dashboard, enter a name, and choose the dashboard folder.
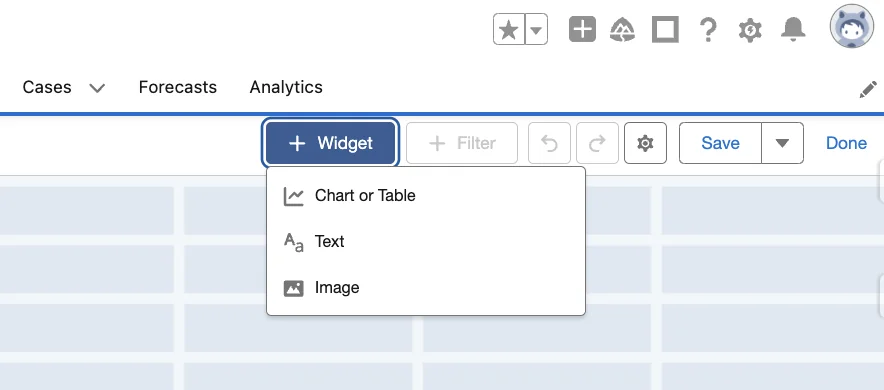
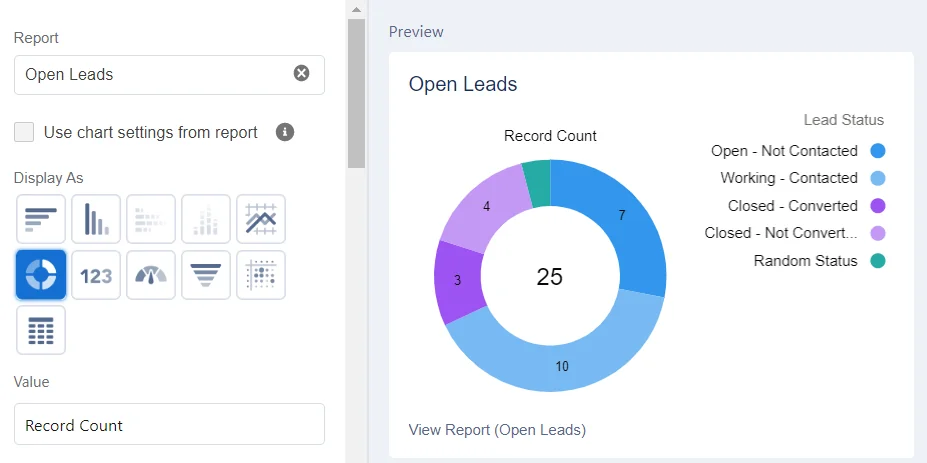
- Add a widget. Click +Widget, choose Chart or Table, select the report, and choose the display type.
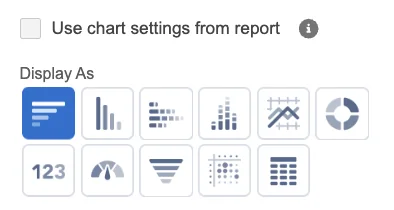
- Set widget properties. Name the widget, choose summary values, adjust display settings, and decide whether to use chart settings from the report.
- Add context widgets. Use rich text for definitions and image widgets only when they help the viewer understand the dashboard.
- Save and test as the intended audience. Confirm folder sharing, running user behavior, filters, and drill-through before you announce the dashboard.
Dashboards and reports Salesforce admins should design together
The phrase dashboards and reports Salesforce teams use in requirements often hides two separate deliverables. The report answers a record-level question. The dashboard answers a monitoring question. Treat them as one design unit so the visual layer does not distort the source data.
| Design item | Report decision | Dashboard decision |
|---|---|---|
| Audience | Who can open and run the source report? | Who can see the dashboard folder and running user view? |
| Question | Which records and fields prove the answer? | Which widget presents the answer with the least explanation? |
| Security | Does the user have object, field, and record access? | Does the running user expose more data than the viewer normally sees? |
| Maintenance | Who owns report filters when processes change? | Who owns widget layout, filters, subscriptions, and running user changes? |
In production, add a short description to each source report that explains the business rule. For example: “Open pipeline excludes Closed Won, Closed Lost, and opportunities with Close Date before the fiscal year start.” This helps admins maintain the Salesforce dashboard after territory, product, or forecast processes change.
Dynamic dashboard Salesforce security model
A dynamic dashboard Salesforce setup uses the dashboard viewer as the running user, so each viewer sees data based on their own access. Salesforce Help describes dynamic dashboards as a way to provide individualized dashboard views without creating separate dashboards and folders for each user. See Salesforce Help: Dynamic Dashboards.
The safer question is not “Can I make it dynamic?” but “Whose access should the numbers represent?” A sales rep usually needs their own pipeline. A regional manager may need records below them in the role hierarchy. An executive dashboard may need one fixed running user so everyone reviews the same number.
Dynamic dashboard Salesforce versus specified running user
| Option | What viewers see | Good use case | Risk to review |
|---|---|---|---|
| Specified running user | Data visible to the selected running user | Company-wide executive scorecard where everyone should see the same totals | Can expose data a viewer could not normally access through reports. |
| Dashboard viewer | Data visible to the logged-in viewer | Rep dashboard, manager dashboard, or support queue dashboard with private sharing | Different users may see different totals, which can confuse meetings unless explained. |
| Viewer chooses user | Depends on permitted user selection | Managers who review teams below them | Requires permission review; do not assign broad data permissions only to solve a dashboard problem. |
Use Configure Dashboard Data Visibility in Lightning Experience and Dashboard Data Visibility Considerations when you review running user choices. Also confirm object permissions, field-level security, sharing rules, role hierarchy, and report folder access.
How to add Salesforce dashboard filters and refresh behavior
Salesforce dashboard filters let viewers narrow results without editing the source reports. Use them for stable dimensions such as owner, region, product family, fiscal period, or forecast category. Do not create filters for fields with hundreds of values; this leads to slow selection and unclear output. Salesforce documents dashboard filter and value limits in the Reports and Dashboards limits page, so check the current limit before you commit to a design.
Refresh behavior also needs explanation. A Salesforce dashboard displays data based on the last refresh. Train users to refresh before operational reviews and to check the timestamp when numbers do not match a freshly run report. For a Salesforce dashboard used in meetings, assign one owner to refresh and verify the page before the meeting starts.
Salesforce dashboard API and deployment notes
Admins can build most Salesforce dashboards in the UI. Developers and release managers still need to understand how dashboards appear in APIs and source control. The Dashboard object is read-only and available from API version 20.0 and later. The Reports and Dashboards REST API can describe dashboard metadata, including components, filters, layout, and running user, through the Dashboard Describe resource.
Use API checks for inventory and audit tasks, not for bypassing security review. The following SOQL example lists dashboard records through the REST API. Adjust the API version for your org and integration standard.
GET /services/data/v60.0/query/?q=SELECT+Id,Title,DeveloperName,FolderName,CreatedDate,LastModifiedDate+FROM+Dashboard+ORDER+BY+TitleFor metadata inspection, use the Reports and Dashboards REST API. This pattern is useful when you need to validate which widgets and filters exist before a release review.
GET /services/data/v60.0/analytics/dashboards/01ZXXXXXXXXXXXXXXX/describeIf you retrieve dashboard metadata with Salesforce CLI or Metadata API, remember that the Salesforce dashboard title users see in the UI may not be the same as the metadata member name. Query the dashboard first when you need the developer name and folder name for a source-driven deployment.
Best practices for Salesforce dashboard design
- Start with decisions, not charts. Write the action each widget should support. Remove widgets that do not change a decision.
- Use fewer widgets on the first page. A Salesforce dashboard with 25 widgets can be valid but still hard to use. Put the most important metrics first.
- Name widgets in business language. “Open Pipeline by Stage” is clearer than “Opportunity Amount Chart.”
- Document filter rules. Add rich text that explains date filters, excluded statuses, currency assumptions, and ownership logic.
- Test with a real user profile. Admin testing is not enough because admins can see data, fields, and folders that the audience may not access.
- Review performance. Avoid source reports that process more records than needed. Tighten filters and use summary reports when the widget only needs summarized output.
- Assign an owner. Salesforce dashboards become stale when nobody owns filters, targets, subscriptions, and running user updates.
Common errors with Salesforce dashboard builds
| Error | Likely cause | Fix |
|---|---|---|
| Widget shows no data | Source report filter excludes records, or running user lacks access | Run the report as the intended user where possible, then review filters and sharing. |
| Chart type is unavailable | Report has missing or insufficient groupings | Add the required grouping in the report, run it, save it, then edit the widget again. |
| Viewer sees a different number than the manager | Dynamic dashboard Salesforce setting uses each viewer’s access | Confirm whether different totals are expected. If not, use a specified running user and document the security decision. |
| Drill-through report is blocked | User can view the Salesforce dashboard folder but not the source report folder | Share both folders with the correct public groups, roles, or users. |
| Salesforce dashboard breaks after owner leaves | Running user or dashboard owner is no longer valid for the process | Change ownership and running user during offboarding. Include dashboards in the user deactivation checklist. |
Related SalesforceTutorial resources
- Salesforce reports tutorial for admins
- custom report types in Salesforce
- Salesforce sharing rules and record visibility
- permission sets in Salesforce
- SOQL examples for Salesforce admins and developers
Frequently Asked Questions
What is a Salesforce dashboard used for?
A Salesforce dashboard is used to show report data as charts, metrics, tables, text, and images in one page. Admins use it when users need a quick view of pipeline, service volume, adoption, data quality, or another measured process.
How do I create a dashboard in Salesforce Lightning?
Create and save the source reports first, open the Dashboards tab, click New Dashboard, add Chart or Table widgets, select the reports, choose display types, add filters if needed, then save and set the dashboard visibility through folders and the running user setting.
What is the difference between dashboards and reports Salesforce users see?
Reports return the underlying rows and summaries. Dashboards display report results as widgets. A dashboard widget depends on a source report, so report type, filters, groupings, and folder access still control what the user can drill into.
When should I use a dynamic dashboard Salesforce option?
Use a dynamic dashboard Salesforce configuration when each viewer should see metrics based on their own record access. Do not use it when executives need one fixed organization-wide view; in that case, choose a specified running user and review the security impact.
Why are some Salesforce dashboard chart types unavailable?
Chart choices depend on the source report. If the report has no grouping, only simple displays are available. If the chart requires multiple groupings, such as a stacked bar chart, add the required row or column groupings in the report and run the report again before editing the widget.