Event monitoring in Salesforce gives admins and security teams access to platform activity data such as logins, report exports, API calls, page views, Apex execution, and metadata activity. In practice, you use it to answer audit questions that normal Salesforce reports cannot answer: who exported data, which integration consumed API capacity, which pages are slow, and which activity needs investigation.
This guide explains how event monitoring works, how to query a Salesforce event log, when to use the Event Monitoring Analytics app, and how to design proactive monitoring Salesforce processes without turning raw logs into noise.
What is Event Monitoring in Salesforce?
Salesforce Event Monitoring is a Salesforce Shield capability that exposes event records generated by user actions, system activity, and integrations. The data is available mainly through the EventLogFile object, the REST API, SOAP API, and analytics tooling. Salesforce documents EventLogFile as the object used to interact with event monitoring data by fields such as EventType and LogDate.
Think of it as an audit data source, not a replacement for field history tracking, Setup Audit Trail, debug logs, or application logs. Each tool answers a different question:
| Tool | Best question it answers | Typical owner |
|---|---|---|
| Event Monitoring | Who accessed, exported, called, or executed something in the org? | Security, platform, operations |
| Setup Audit Trail | Who changed Salesforce setup metadata? | Admins, release managers |
| Field History Tracking or Field Audit Trail | Who changed a tracked field value on a record? | Data owners, compliance teams |
| Debug Logs | Why did a transaction fail or consume limits? | Developers |
| Login History | Who logged in and from where? | Admins, identity teams |
In enterprise orgs, teams usually start with a few event types: Login, Report Export, API, Apex Execution, Lightning page performance, URI, and Metadata API Operation. The supported list can change by release and license, so check the official EventLogFile supported event types before you build a dashboard or scheduled job.
How does a Salesforce event log work?
A Salesforce event log is a generated file that stores rows for one event type and time period. The EventLogFile record stores metadata about the file, including the event type, log date, file length, and a LogFile endpoint that returns the CSV data. The CSV columns vary by event type, so a parser for Login events should not assume the same columns as Report Export or API events.
For a developer, the important design point is that event log data is read through platform APIs. You normally extract it to a data lake, SIEM, observability platform, or CRM Analytics dataset. Avoid parsing large CSV files inside synchronous Apex. Apex CPU time, heap limits, and callout limits make large log processing a poor fit for a trigger, LWC controller, or synchronous admin button.
Salesforce event log fields to query first
Start with a narrow SOQL query that returns only log file metadata. Then download the LogFile content only for the records you need.
SELECT Id, EventType, LogDate, LogFileLength, Sequence, Interval, CreatedDate
FROM EventLogFile
WHERE EventType IN ('Login', 'ReportExport', 'API', 'ApexExecution')
AND LogDate = LAST_N_DAYS:7
ORDER BY LogDate DESC, EventType ASC
Governor limit note: this SOQL is safe as a discovery query because it returns file records, not every row inside each CSV file. If your org generates many event files, add an EventType filter and a bounded LogDate filter before you automate extraction.
Download a Salesforce event log with REST API
The REST pattern has two steps: query EventLogFile, then fetch the LogFile field for the selected record. The example below uses API v67.0, which aligns with the Summer ’26 release cycle. If your org is not yet on that version, use the highest version returned by the REST API versions resource for your instance.
# 1. Query event log files.
curl -H "Authorization: Bearer $ACCESS_TOKEN" \
  "https://your-domain.my.salesforce.com/services/data/v67.0/query/?q=SELECT+Id,EventType,LogDate,LogFileLength+FROM+EventLogFile+WHERE+EventType='ReportExport'+ORDER+BY+LogDate+DESC+LIMIT+5"

# 2. Download the CSV for one EventLogFile record.
curl -H "Authorization: Bearer $ACCESS_TOKEN" \
  "https://your-domain.my.salesforce.com/services/data/v67.0/sobjects/EventLogFile/0ATXXXXXXXXXXXXXXX/LogFile" \
  -o report-export-log.csv
Salesforce documents this access pattern in the REST API guide for using event log files. The same architecture also works from middleware such as MuleSoft, a scheduled Python job, or a security platform that can authenticate to Salesforce with OAuth.
Python example for scheduled extraction
This sample downloads recent event logs to local files. In production, store secrets in a vault, rotate connected app credentials, and write files to controlled storage. Do not run a script like this from a user laptop for regulated logs.
import csv
import os
from pathlib import Path

import requests

INSTANCE_URL = os.environ["SF_INSTANCE_URL"].rstrip("/")
ACCESS_TOKEN = os.environ["SF_ACCESS_TOKEN"]
API_VERSION = "v67.0"

session = requests.Session()
session.headers.update({"Authorization": f"Bearer {ACCESS_TOKEN}"})

query = """
SELECT Id, EventType, LogDate, LogFileLength
FROM EventLogFile
WHERE EventType IN ('Login', 'ReportExport', 'API')
AND LogDate = LAST_N_DAYS:3
ORDER BY LogDate DESC
""".strip()

response = session.get(
    f"{INSTANCE_URL}/services/data/{API_VERSION}/query/",
    params={"q": query},
    timeout=60,
)
response.raise_for_status()

output_dir = Path("salesforce-event-logs")
output_dir.mkdir(exist_ok=True)

for record in response.json().get("records", []):
    file_name = f"{record['LogDate']}-{record['EventType']}-{record['Id']}.csv"
    log_response = session.get(
        f"{INSTANCE_URL}/services/data/{API_VERSION}/sobjects/EventLogFile/{record['Id']}/LogFile",
        timeout=120,
    )
    log_response.raise_for_status()
    (output_dir / file_name).write_bytes(log_response.content)

    # Optional sanity check: read the header without loading the full file into memory.
    with open(output_dir / file_name, newline="", encoding="utf-8") as handle:
        reader = csv.reader(handle)
        print(file_name, next(reader, []))
How to use Event Monitoring Analytics App
The Event Monitoring Analytics app is the Salesforce-provided CRM Analytics app for exploring event data without building every dataset and dashboard from zero. Salesforce Help states that the app integrates event monitoring and Setup Audit Trail data to show user and org behavior. It also includes prebuilt dashboards so admins can inspect event trends faster than they could with raw CSV files alone.
Use the app when the audience needs dashboards, trends, and scheduled reviews. Use API extraction when the audience needs long-term retention, SIEM correlation, custom anomaly detection, or a warehouse model. Many enterprise orgs use both: the event monitoring analytics app for Salesforce admins and a downstream security platform for the security operations center.
Event monitoring analytics app setup checklist
- Confirm the org has the required Event Monitoring and CRM Analytics licensing.
- Assign the correct Event Monitoring Analytics permission sets to app creators and viewers.
- Create the app from Analytics Studio using the Salesforce template.
- Schedule the dataflow so datasets refresh after Salesforce generates event log files.
- Limit dashboard access to users who have a business need to view audit data.
- Validate the dashboards with a known event, such as a test report export or a controlled login test.
Do not give broad dashboard access just because the data is in analytics. Event logs can contain user identifiers, IP addresses, session details, URI paths, report names, and other operational data that security teams may treat as sensitive.
When the event monitoring analytics app is not enough
The app helps with dashboarding, but it does not remove the need for data design. You still need clear definitions for incident thresholds, excluded service accounts, expected integration windows, and escalation owners. For example, a nightly integration that calls the REST API at 2:00 AM should not generate the same alert as a human user exporting reports after a failed login sequence.
Use CRM Analytics for analysis inside Salesforce. Use an external store when you need correlation with identity provider logs, endpoint logs, proxy logs, or other SaaS systems.
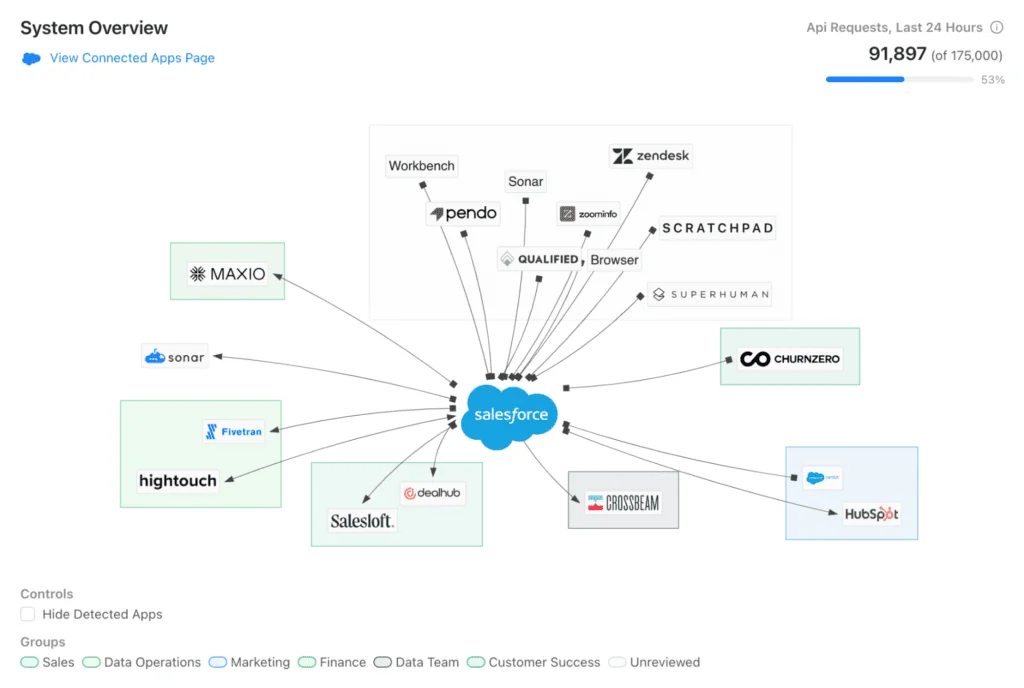
How to monitor integrations and API usage with Event Monitoring
Integrations often share a few failure patterns: a service account gains more access than needed, an OAuth connected app stays active after a vendor change, a batch job starts consuming API calls, or a middleware mapping changes without a Salesforce release note. Event monitoring helps you find these patterns because API and metadata events carry context that normal record reports do not expose.
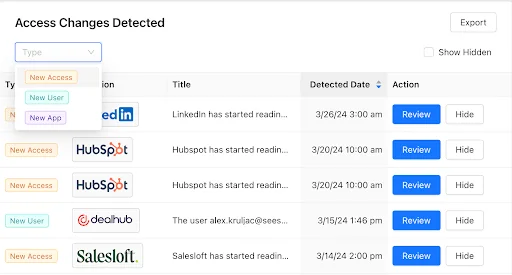
Find newly active connected apps and integration users
Start with login and API activity. Group events by user, client, IP range, and time window. Then compare the results with your approved connected app inventory. This gives operations teams a factual list of integrations that actually touched the org, not just a list of apps that exist in Setup.
A practical review often starts with these questions:
- Which integration users logged in during the last 30 days?
- Which connected apps generated API traffic outside the approved window?
- Which users used a client that is not on the integration register?
- Which IP ranges do not match the vendor or corporate network?
For tighter access control, combine this review with connected app policies, OAuth scopes, session settings, and permission set groups. Event monitoring shows what happened; your identity and authorization model determines what should be allowed next time.
Track Salesforce setup and metadata activity
Configuration monitoring needs two data sources. Use Setup Audit Trail for admin setup changes. Use Event Monitoring for platform activity around deployment, metadata retrieval, and API access. The Metadata API Operation event type is useful when release managers need to see deployment and retrieval activity from tools such as CI/CD pipelines.
In production orgs, this prevents a common mistake: treating every metadata action as suspicious. A deployment from your CI user during an approved release window is expected. A metadata retrieval by a personal admin account at midnight may deserve review. The difference comes from joining event data with your change calendar and named integration owners.
Use Salesforce event log data to manage API capacity
A Salesforce event log for API usage helps identify which clients and users are generating calls. This matters when an org approaches daily API limits or when one integration consumes capacity that other systems need. Start with API-related event types, then aggregate by user, client name, and time window.
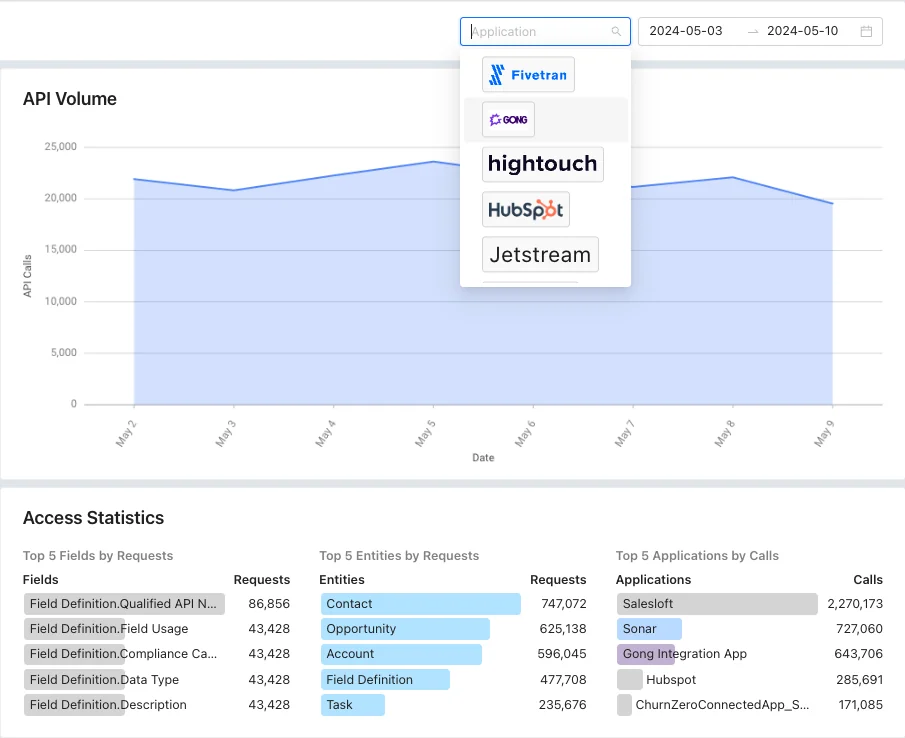
For integration owners, the output should not be only a chart. Create an action table like this:
| Signal | Likely cause | Action |
|---|---|---|
| API calls increased after a package release | New sync process, polling logic, or retry loop | Review vendor release notes and connected app logs |
| High calls from one integration user | Shared service account used by multiple systems | Split service accounts by system and assign scoped permission sets |
| Calls continue after a project ends | Stale connected app or unattended job | Revoke OAuth tokens and disable unused connected apps |
| API calls spike after errors | Retry policy without backoff | Add exponential backoff and alert on repeated failures |
How to build proactive monitoring Salesforce alerts
Proactive monitoring Salesforce design starts with a rule that the business can explain. Do not alert on every event. Alert when a pattern has risk, cost, or user impact. Good thresholds combine event type, user profile, integration owner, time, source IP, and volume.
Event Monitoring through EventLogFile is best for scheduled analysis. Real-Time Event Monitoring is the better fit when you need near-real-time response. Salesforce Trailhead describes Real-Time Event Monitoring as standard events streamed by Salesforce through a publish-subscribe model. Trailhead also notes that these streaming events are retained for up to three days, so plan downstream storage if you need longer history.
Proactive monitoring Salesforce rule examples
| Use case | Event data to inspect | Example alert condition |
|---|---|---|
| Data export review | Report Export, user, report identifier, time | Non-admin user exports more than a set number of reports after business hours |
| Integration drift | API events, connected app, integration user, IP | Known service account uses a new client or source network |
| Deployment oversight | Metadata API Operation, actor, operation, release window | Metadata deployment occurs outside the approved release window |
| Page performance | Lightning page events, run time, page URL | Median page load exceeds the agreed internal threshold for a business-critical app |
| Apex performance | Apex Execution, CPU time, request ID, user | Repeated transactions approach CPU limits after a deployment |
Keep a suppression list for integration users and maintenance windows. Without that, your team will learn to ignore the alerts. The alert should include a link to the runbook, the owner, and the exact fields that triggered the rule.
Audit log delivery for security and compliance
Security teams often need event data for access reviews, incident investigations, and control evidence. Build a repeatable process instead of exporting logs manually during every audit. The process should define who can request a log, who can approve the request, where files are stored, how long they are retained, and how sensitive fields are protected.
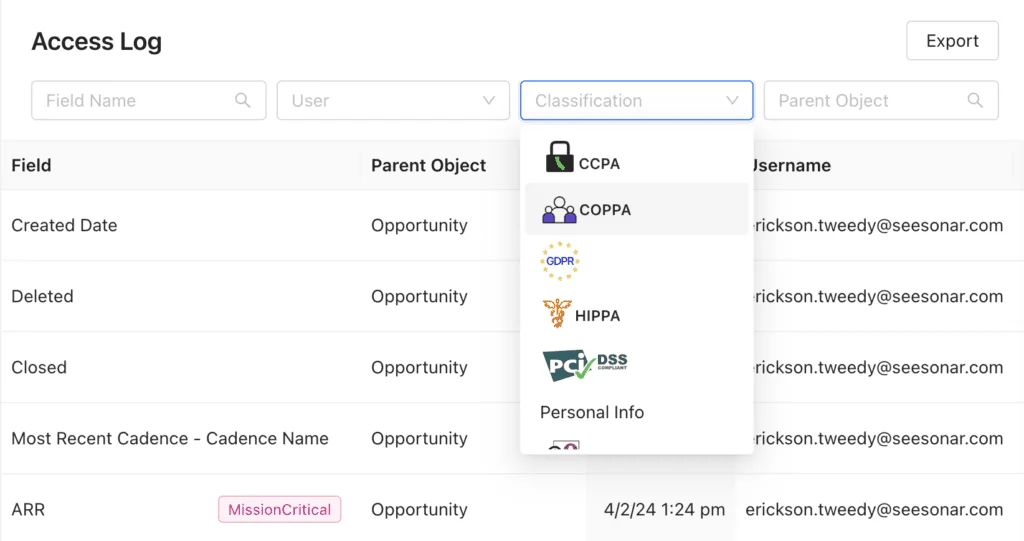
For regulated environments, avoid sending raw event logs through email. Use a controlled repository with access logging, encryption, and retention policies. When auditors ask for evidence, provide filtered files or dashboards that answer the control question without exposing unrelated user activity.
Best practices for Event Monitoring implementation
Define ownership before building dashboards
Event data crosses admin, security, compliance, and integration teams. Assign ownership by use case. For example, the Salesforce platform team can own API capacity reports, the security team can own export and login review, and release management can own metadata activity review.
Separate human users from service accounts
Use dedicated integration users where licensing and architecture allow it. A shared named user makes logs hard to interpret and creates security risk. Use permission sets that match the integration’s job, not a cloned admin profile.
Normalize IDs before analysis
Raw logs often contain user IDs, organization IDs, session keys, URI paths, and client identifiers. Create lookup tables for user, profile, permission set group, connected app, business owner, and system name. This turns event monitoring from a CSV review into operational reporting.
Test with known events
Before a dashboard goes live, generate a controlled event and confirm that it appears where expected. Export a test report, run a known API call, perform a login from an approved network, and execute a planned metadata deployment. This catches parser mistakes and dashboard filters before real investigations depend on the data.
Do not confuse raw volume with risk
A high event count does not always mean an incident. A low event count does not always mean safety. A single report export by a privileged user may matter more than thousands of expected API calls from a nightly sync. Rank rules by impact and likelihood.
Common errors with Event Monitoring
| Error or symptom | Cause | Fix |
|---|---|---|
| Only a few event types appear | License, permission, or event availability limitation | Confirm Event Monitoring licensing and check supported event types in the current API docs |
| Dashboard shows stale data | Dataflow ran before event files were available | Schedule the dataflow after log generation normally completes for the org |
| API usage cannot be tied to a vendor | Multiple systems use one integration user | Create separate service accounts and connected apps where possible |
| CSV parser fails after adding event types | Each event type can have different columns | Parse by EventType and validate headers before loading rows |
| Too many false positives | Alerts ignore business context | Add release windows, approved IPs, service account rules, and thresholds |
Security and access considerations
Event logs can reveal sensitive operational details. Treat access to event monitoring data as privileged access. Users who view, export, or query logs should have a business reason and should be reviewed like other high-privilege users.
Apply these controls:
- Grant access through permission sets rather than broad profile changes.
- Review users with access to Event Monitoring Analytics dashboards.
- Keep connected app OAuth scopes narrow for extraction jobs.
- Store downloaded logs in an encrypted repository with retention rules.
- Mask, filter, or aggregate fields before sharing evidence outside the admin and security teams.
If your org uses Salesforce Shield, align Event Monitoring with Shield Platform Encryption and Field Audit Trail. These tools solve related but different problems: encryption protects data at rest, Field Audit Trail keeps long-term field change history, and event monitoring records operational activity.
Related SalesforceTutorial resources
- Salesforce reports and dashboards for admins building operational visibility.
- Salesforce Data Loader for understanding API-based data exports and imports.
- Salesforce security model for profiles, permission sets, sharing, and field-level security.
- Salesforce API integration patterns for service accounts, OAuth, and connected apps.
Official Salesforce references
- EventLogFile object reference
- Using event log files with the REST API
- Event Monitoring Analytics App help
Frequently Asked Questions
What is event monitoring in Salesforce?
Event monitoring in Salesforce is the process of reviewing platform event data for user activity, API usage, report exports, login behavior, page performance, Apex execution, and other operational signals. The main data source is the EventLogFile object, which exposes generated log files through Salesforce APIs.
What is the Event Monitoring Analytics App?
The Event Monitoring Analytics app is a CRM Analytics app from Salesforce that provides datasets and dashboards for event data. It helps admins review trends without building every dashboard from raw Salesforce event log files.
How do I download a Salesforce event log?
Query the EventLogFile object to find the log record, then call the LogFile resource for that record through the REST API. Filter by EventType and LogDate first so you download only the files needed for the investigation.
Is Event Monitoring the same as Setup Audit Trail?
No. Event Monitoring records operational events such as API calls, report exports, logins, and page activity. Setup Audit Trail records setup changes made by admins and automated tools. Use both when you need to connect user activity with configuration changes.
Can Event Monitoring track API usage by integration?
Yes, API-related event logs can help identify API activity by user, client, time, and source context. For better reporting, give each major integration its own connected app and service account so the Salesforce event log data maps to a clear business owner.
How do you build proactive monitoring Salesforce alerts?
Build proactive monitoring Salesforce alerts by defining a risk pattern, selecting the event fields that prove the pattern, and setting thresholds that account for users, time windows, IP ranges, and integration owners. Use Real-Time Event Monitoring for near-real-time response and EventLogFile extraction for scheduled analysis.