Using Developer Console in Salesforce
We can use a developer console to create, debug and test applications in your Salesforce organization. To open developer console follow below steps.
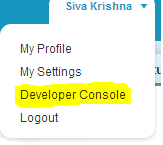
Click on your name -> Click on developerconsole. See the below image for reference.
By clicking on developerconsole it will open in new window.
Executing Apex code in the developer console
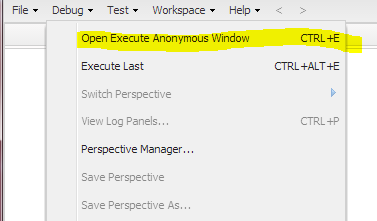
1. Go to debug -> and click on “Open Execute Anonymous Window” or Ctrl/E
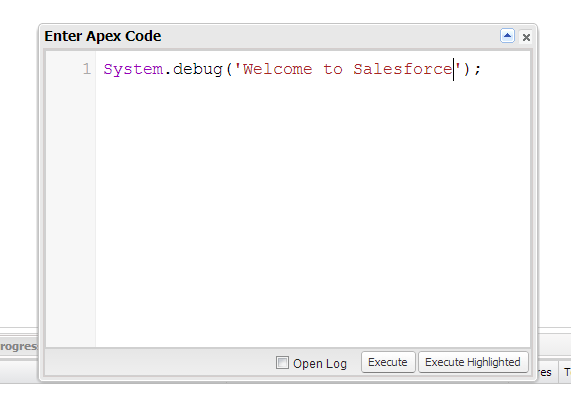
2. Enter the code in that window and execute.
3. After executing the code every time log is created. If you select open log check box, then directly it will navigate to Log.
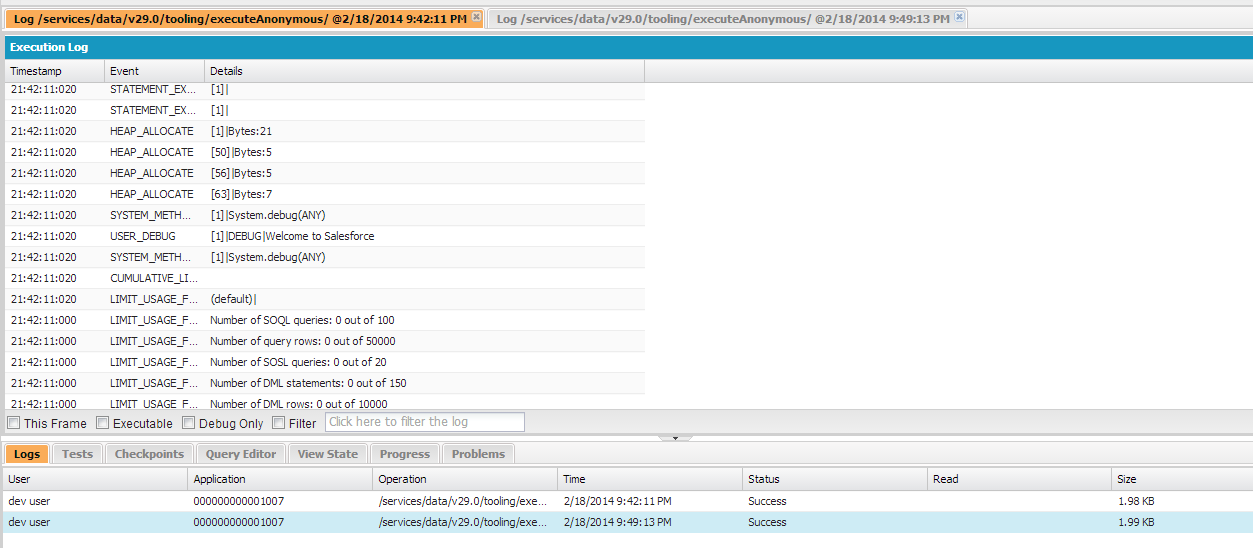
To open the logs double click on the log. We can open multiple logs at a time to compare results.
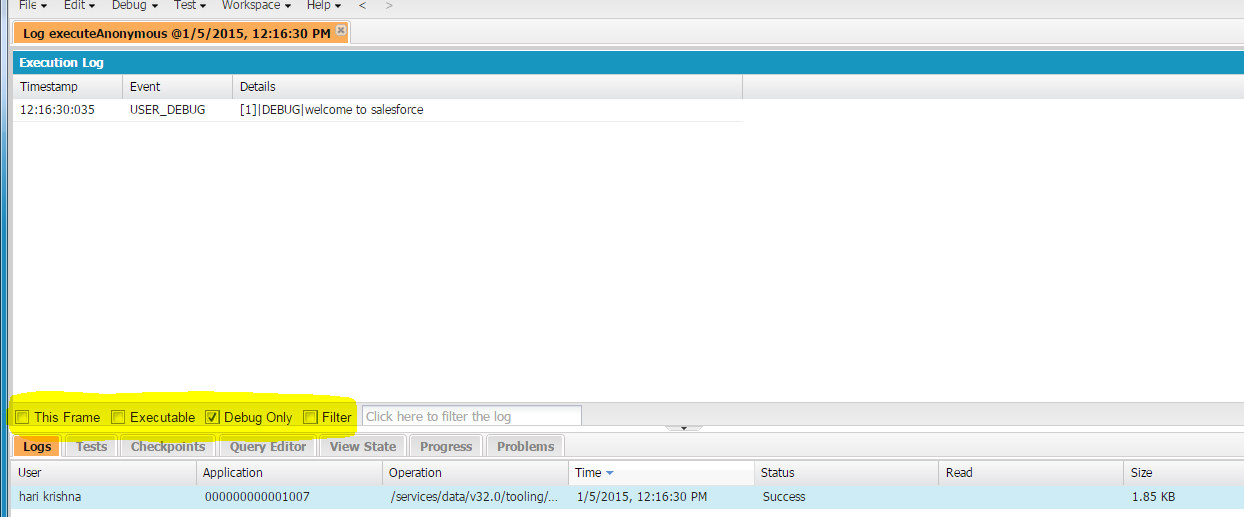
How to view results in console? Once you click on execute button you will get log file, this log contain lots of information. Under log there are are some check boxes available to filter the results. This check box are use full to filter the log result For example log file in the above screen is very long and difficult to understand. By using this filters we can filter log file and which is simple to understand. See the below screen for reference.
In the above screen, i only selected debug log check box, So it will display debug log statements. Like that by clicking on other check boxes, you can differentiate log results.
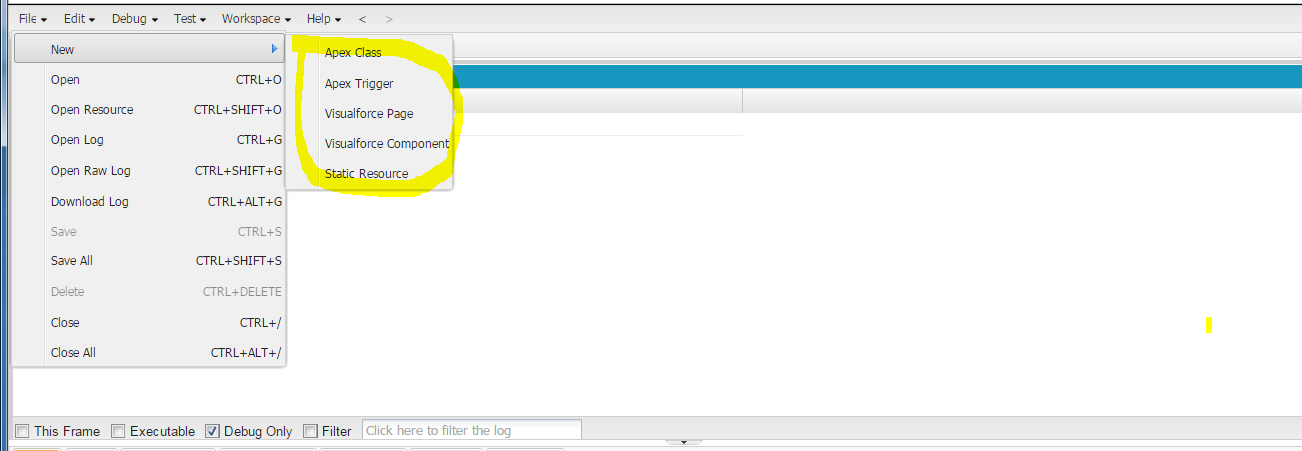
4. We can create/open classes, triggers, pages and static resources by using console.
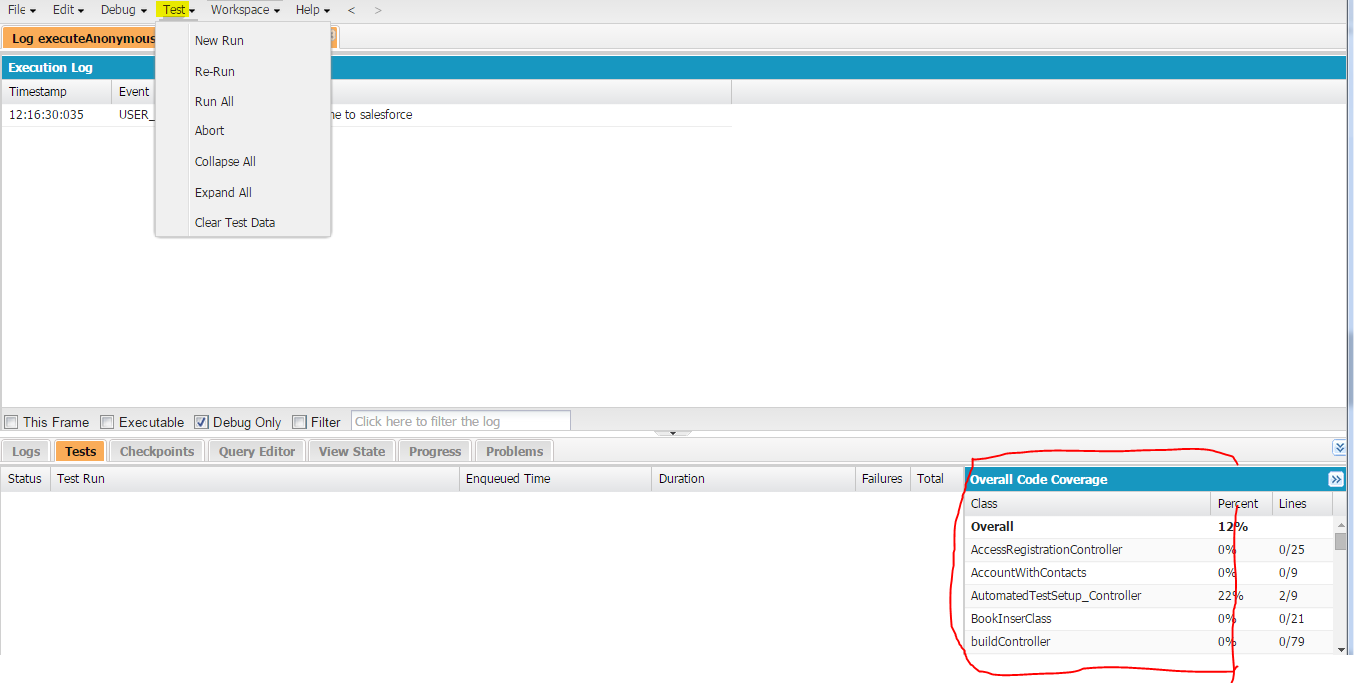
5. We can also run test classes, abort test class execution, we can clear test data and we can see code coverage of classes & triggers.
For more information see the salesforce reference