Debugging and Tuning in Salesforce.com :- In our previous Salesforce Developer Tutorial we have clearly learned about Configuring Visualforce pages as Tabs. In this Salesforce Visualforce Training Tutorial we are going to learn about Debugging and Tuning in Salesforce.com
What Debugging and Tuning in Salesforce.com ?
Debugging and Tuning in salesforce.com is the process of troubleshooting unexpected behaviour and bugs from visualforce user interface by using system log information.
In debugging and Tuning process, system log information is very useful because every interctions with force.com are entered in system log information and helps to examine unexpected behaviour in depth.
Go to Setup=>Developer Console.
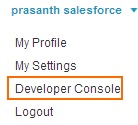
Click on Developer Console.
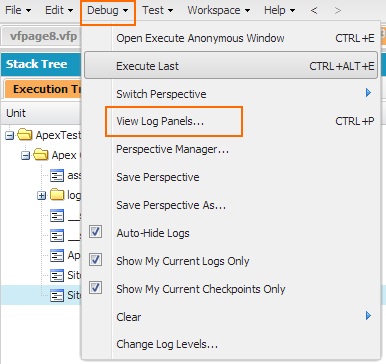
Click on Debug=>View Log Panels as shown above.
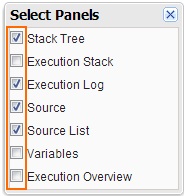
Select panels Check box to visibile in developer console editor.
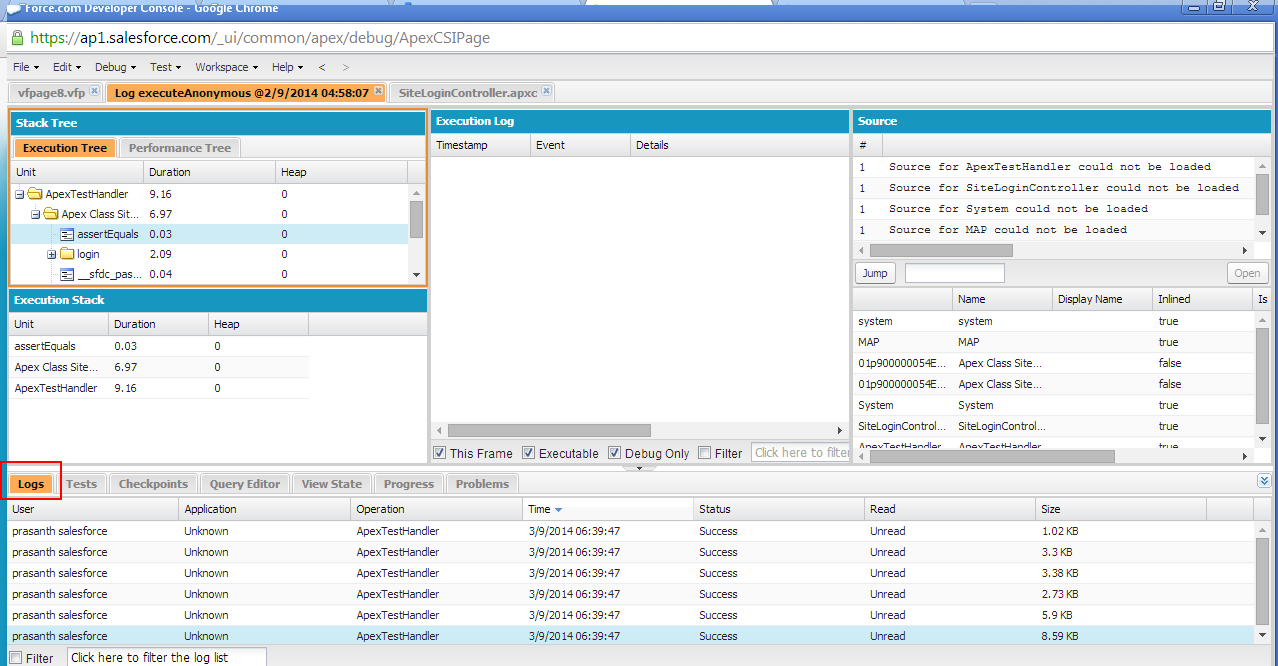
When log entry tab has been clicked other log panels information will be refreshed with detailed information. The detailed information is about the Apex code which executed in the controller associated to it’s visualforce page.
If any bug or unexpected behaviour exists in our controller code that bug can be fixed in the stack, execution log and executed Units panels. System.Debug statement is used in controller to help troubleshooting.
View State in Developer console is used to increase the performance of visualforce page which contains the values of local variables in our controller. Usually local variable are encoded and embedded in visualforce page itself in a hidden field.
In visualforce development mode footer contains many tabs like Logs, Tests, Checkpoints, Query Editor, ViewState, Progress, Problems. All these are used to show different types of data.