Salesforce data analytics through reports and dashboards provides organizations with powerful tools to visualize, analyze, and act on their CRM data. This guide covers report creation, dashboard configuration, data security considerations, and integration with tools like Data Loader and Chatter data model.
In Salesforce, we have Reports, Dashboards, and folders which are used for comprehensive data analytics. Through reports and dashboards, we generate customized data in visual formats including graphs, pie charts, and interactive components. Graphical representation of data is accomplished through dashboards, while reports provide the underlying data structure.
Reports and Dashboards in Salesforce Overview
Reports and dashboards in Salesforce are analytics tools that allow all users in an organization to manage data through structured reports and visual representations. Through reports and dashboards, sales teams can produce sales pipeline reports, marketing teams can track campaign progress, and administrators can create custom reports for specific business needs.
Report Types and Data Sources
Reports in Salesforce help organizations access comprehensive data analytics within the CRM platform. When creating reports, data displays in rows and columns format, with rule criteria determining how data appears.
Reports can be generated for two types of objects:
- Standard Objects – Pre-built objects like Accounts, Contacts, Opportunities
- Custom Objects – Organization-specific objects created for unique business requirements
Standard Reports: Generate reports for Accounts, Contacts, Opportunities, Products, Sales, and Leads. These provide forecasting details and performance metrics out-of-the-box.
Custom Reports: Created for custom objects through Setup → Build → Create → Report Types. Custom report types define which objects and fields are available for reporting.
Key Components of Salesforce Reports
| Component | Description |
|---|---|
| Report Types | Define the set of objects and fields available for reporting. Standard and custom report types exist. |
| Filters | Criteria to narrow down the data displayed in the report. |
| Groupings | Organize data into categories, such as grouping by date, account, or salesperson. |
| Summary Fields | Calculated fields like sums, averages, and counts that provide aggregate data. |
| Visualization | Charts and graphs that represent data visually for easier interpretation. |
Salesforce Data Security in Reports and Dashboards
Data security in Salesforce reports and dashboards operates through multiple layers of access control. Understanding these security mechanisms is crucial for administrators and developers working with sensitive organizational data.
Object-Level Security
Object-level security controls which objects users can access through profiles and permission sets. Users cannot create reports on objects they lack read access to.
Field-Level Security
Field-level security (FLS) determines which fields appear in reports. Fields marked as not readable for a user’s profile will not display in their reports, even if included in the report definition.
Record-Level Security
Record-level security through Organization-Wide Defaults (OWD), sharing rules, and role hierarchy determines which specific records users can view in reports. This includes:
- Organization-Wide Defaults settings
- Role hierarchy access
- Sharing rules (criteria-based and owner-based)
- Manual sharing
- Team access for opportunities and cases
Running User Context for Dashboards
Dashboards can run in different user contexts:
- Static Running User: All users see data based on a single user’s access
- Dynamic Dashboards: Each user sees data based on their own access permissions
Dashboards in Salesforce Overview
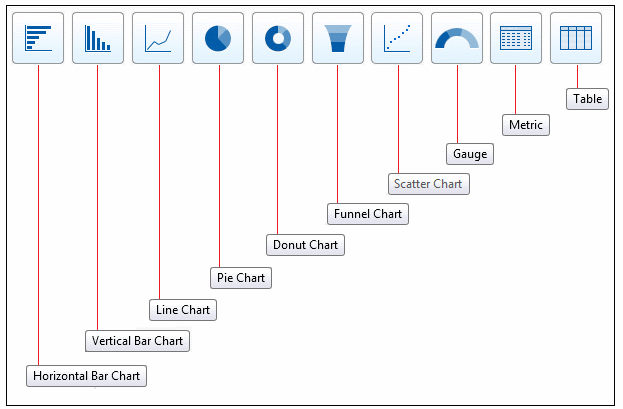
Dashboards in Salesforce provide pictorial representation of reports using graphical elements. Dashboard components (graphical elements) include:
- Charts
- Gauges
- Tables
- Metrics
- Scatter chart
- Funnel chart
- Donut chart
- Pie chart
- Line chart
- Vertical bar chart
- Horizontal Bar chart
- Visualforce pages
Key Components of Salesforce Dashboards
| Component | Description |
|---|---|
| Dashboard Components | Visual elements like charts, tables, gauges, and metrics that display report data. |
| Data Sources | Each component is based on a specific report that serves as its data source. |
| Dynamic Dashboards | Allow different users to view the dashboard with data filtered based on their access permissions. |
| Dashboard Filters | Enable users to filter all components on the dashboard simultaneously based on specific criteria. |
| Refresh Options | Set schedules for dashboard data to refresh automatically or refresh manually as needed. |
Through dashboards, we access data in diagram format. Visual representation of data is accomplished through dashboards in Salesforce CRM. We can present data through charts, gauges, tables, metrics, scatter charts, funnel charts, donut charts, pie charts, line charts, vertical bar charts, horizontal bar charts, and Visualforce pages.
Chatter Data Model Integration
The Chatter data model integrates with Salesforce reports and dashboards to provide social collaboration analytics. Key Chatter objects available for reporting include:
Core Chatter Objects
- FeedItem: Represents posts in Chatter feeds
- FeedComment: Comments on Chatter posts
- CollaborationGroup: Chatter groups and their membership
- UserFeed: User profile feed items
- EntitySubscription: Records users are following
Chatter Analytics Use Cases
Organizations use Chatter data model reporting for:
- Measuring user engagement and adoption
- Tracking collaboration patterns across teams
- Identifying most active contributors
- Analyzing content sharing trends
- Monitoring group participation metrics
Data Loader Integration with Reports
Salesforce Data Loader serves as a critical tool for importing, exporting, and managing data that feeds into reports and dashboards. Understanding Data Loader capabilities enhances data analytics workflows.
Data Loader Operations for Analytics
- Insert: Load new records for reporting
- Update: Modify existing records that impact report data
- Upsert: Insert or update records based on external ID
- Delete: Remove records from reporting datasets
- Export: Extract data for external analysis
- Export All: Include deleted and archived records
Data Loader Best Practices for Reporting
- Use selective queries to export only necessary data
- Schedule regular data exports for backup and analysis
- Validate data quality before loading to ensure accurate reports
- Use external IDs for reliable upsert operations
- Monitor API usage limits during large data operations
Folders in Reports and Dashboards
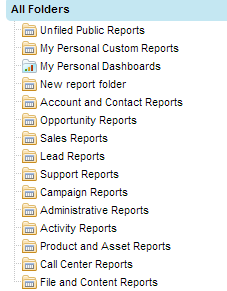
Folders in Salesforce store data, files, images, reports, and dashboard analytics data. The folder list, represented by folder icons, contains all report folders. Organizations can create new folders to store reports and dashboards with configurable security settings.
Folder Security Options
- Read-only access: Users can view but not modify folder contents
- Read/write access: Users can view and modify folder contents
- Manager access: Full control including sharing and deletion rights
Advanced Analytics Features
Einstein Analytics Integration
Salesforce Einstein Analytics (now Tableau CRM) extends traditional reports and dashboards with advanced analytics capabilities including predictive modeling and AI-driven insights.
Custom Report Types
Create custom report types to define relationships between objects and specify available fields. Navigate to Setup → Object Manager → [Object] → Report Types to create custom report types.
Cross-Object Reporting
Leverage relationships between objects to create comprehensive reports spanning multiple object types. Use lookup and master-detail relationships to access related data.
Performance Optimization
Report Performance Best Practices
- Use selective filters to reduce dataset size
- Limit date ranges to necessary timeframes
- Avoid excessive groupings and summary fields
- Use indexed fields in filter criteria when possible
- Schedule resource-intensive reports during off-peak hours
Dashboard Performance Considerations
- Limit dashboard components to 20 or fewer
- Use summary reports as data sources when possible
- Implement dashboard filters to reduce data processing
- Schedule automatic refreshes during low-usage periods
Frequently Asked Questions
What are common Salesforce data security interview questions?
Common data security interview questions include: How does field-level security affect reports? What is the difference between organization-wide defaults and sharing rules? How do dynamic dashboards work? How does role hierarchy impact report visibility? What security considerations apply when creating custom report types?
How does the Chatter data model integrate with Salesforce reporting?
The Chatter data model provides objects like FeedItem, FeedComment, and CollaborationGroup that can be used in custom report types. This enables reporting on user engagement, collaboration patterns, and social activity within Salesforce. Organizations use Chatter analytics to measure adoption and identify active contributors.
What are key Data Loader interview questions for Salesforce roles?
Key Data Loader interview questions include: What operations does Data Loader support? How do you handle large data volumes? What is the difference between insert and upsert? How do you schedule Data Loader operations? What are API limits for Data Loader? How do you handle data validation errors?
How do you ensure data security when using Salesforce Data Loader?
Data security with Data Loader involves using secure authentication methods, encrypting data files, validating data before import, using selective queries for exports, monitoring access logs, and ensuring compliance with organizational data governance policies. Always use HTTPS connections and store credentials securely.
What is the relationship between reports and dashboards in Salesforce?
Reports serve as data sources for dashboard components. Each dashboard component must be based on a report. Reports provide the underlying data structure and filtering, while dashboards provide visual representation through charts, gauges, and other graphical elements. You cannot create a dashboard component without an underlying report.